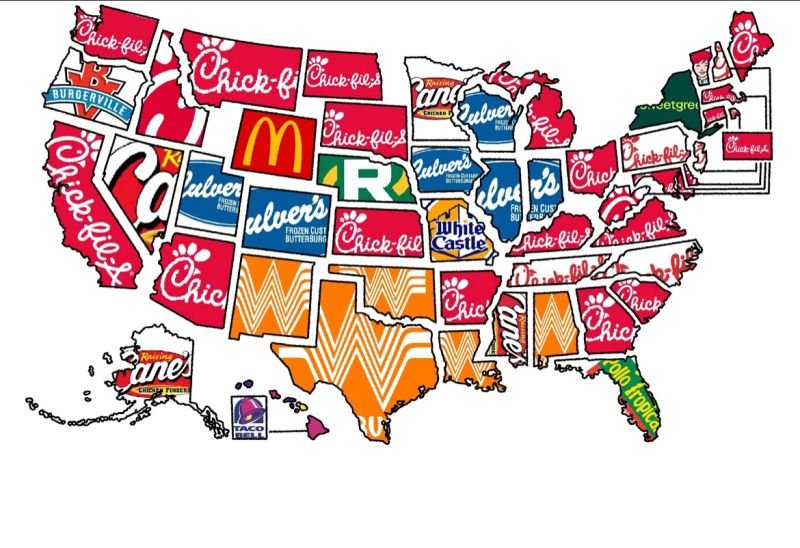
Chick-fil-A Dominates Share of Search in U.S.
Share of Search Report Shows Chick-fil-A Is National Favorite
Strong Showing of Regional Chains Over National Brands
New data highlighting fast food chains with the highest Share of Search in each of the 50 U.S. states. The sometimes controversial Chick-fil-A dominated the report earning the top spot in 27 of 50 states.
hick-fil-A locations had the highest Share of Search in 27 out of 50 states.
Chick-fil-A locations were the top searched chains in blue states like California and Massachusetts, where growth of the chain is happening rapidly.
Regional chains like Wisconsin-based Culver's and Texas-headquartered Whataburger were the top results in their respective states, as well as many neighboring states in the region, over other nationally-recognized chains.
My Telescope measured how the top 10 fast food chains in each state rank according to Google search volume when users search for the chain's locations statewide known as Share of Search.
Share of Search is a marketing metric that measures the relative interest for a search term in relation to a defined set of search terms. Research has shown that there is a correlation between what we search for and a final outcome, and that Share of Search can often predict shifts in Share of Voice over time.
"Share of search measures search data combined with sentiment analysis to give a more accurate measurement of consumer and business purchasing intent and demand," said Rodrigo Graviz, CEO of My Telescope. "Data can be geo-fenced by state or country to give an accurate look into what people in the area are searching for. When combined with specific keywords, Share of Search data can give valuable insights on what people are going to do, what they think, how they feel, and what they're going to buy."
Do you want to start your own tracker? Make sure to look for the Search lift!
Share of Search:
“Share of Search” is the most accurate measurement of consumer and business purchasing intent and demand. For the first time, businesses can use AI/Machine Learning and big data to track consumer interest in buying their products and their competitors’ products and why. Want to know your competitors’ market share or your own?
Share of Search correlates on average, 83% of a brand’s market share.
Share of Search analysis vs Panel data:
My Telescope uses data on what people actually search for and not what they think they might need when asked. As the advertising guru David Ogilvy once said, ” Consumers don’t think how they feel. They don’t say what they think, and they don’t do what they say.”


