How Higher Education Can Use “Share of Search” to Track The Incoming Class of 2026
With acceptance letters sent out to university applicants this last month, top universities are now gearing up to see who is planning to commit to their institutions.
Most colleges use econometric modeling to try to predict admissions, determine the likelihood that a student will enroll and put together financial aid packages. However, much of this modeling is based on the university’s past enrollment numbers and other primary data that does not take into consideration competing institutions that are also vying for a candidate’s commitment. With factors like the ever-shifting global pandemic affecting students’ decisions to attend campuses in person, econometric modeling can only offer so much help to institutions hoping to understand student interest in attending their school over many of the other top universities. Additionally, without this key information of what competing institutions may be offering, and what prospective students are looking for in their future education, accepted students may catch admissions officers by surprise by committing to a different school, and having financial repercussions.
Besides econometric modeling, there are other data points a college or university might consider when trying to understand interest in enrollment for their institution. Rather than relying on focus groups, expensive industry research, or biased metrics that don’t take into consideration competing collegiate programs, institutions of higher learning can now turn to one key metric to determine students’ interest in enrolling: Share of Search.
What Is Share of Search?
In an increasingly digital world, a new metric has emerged as a more accurate measurement of consumer and business purchasing intent and demand for products: Share of Search. There is no better way to measure a consumer’s intent to purchase than to measure what they search on the web. This same logic can be applied to higher learning, as the schools that students are searching for are the intended schools they may apply to or consider attending.
To calculate a brand’s Share of Search, you can take the number of organic searches your brand received during a specific period, and divide it by the number of searches all the brands in your industry received at that time. Several tools will be able to measure this for you, and some even have the capability to track this Share of Search over time to visualize how market share can change over time.
Research has shown that Share of Search is the most accurate measurement of consumer and business purchasing intent and demand. For the first time, businesses can use AI/Machine Learning and big data to track consumer interest in buying their products and their competitors’ products and why. Want to know your competitors’ market share or your own? Share of Search represents, on average, 83% of a brand’s market share.
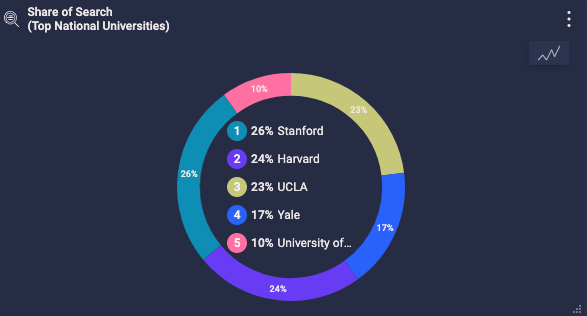

Share of Search, when combined with other data like sentiment search and search volume, tells a full story of where brands stand in the market based on what people search for. As an example, we can see here from these charts provided by My Telescope that when five of the top colleges are compared with each other in terms of committing to the schools, Stanford comes out on top with 26%. Therefore, admissions officers at Stanford could reasonably deduce that 83% of those searching for “Stanford Acceptance” might consider committing to the school. This gives them a good predictive number to work with before starting the econometric modeling that takes into account prospective students’ financial aid needs. This provides valuable trend information to schools looking to understand how people’s thoughts toward the brand might translate into commitment, and further, long-term success of recruiting top candidates.
How Share of Search Helps College Recruiters and Admissions
While hundreds of tools exist to measure marketing effectiveness for short-term success and ROI, historically it has been difficult to measure how this short-term success actually translates into long-term loyalty.
Advertising veteran and Founding Chairman of MDC Media Partners (now Stagwell's Assembly Global) Steve Farella, who has spent nearly four decades in the media industry, recognized this as a leading problem in the marketing industry, and recently joined the board of directors for leading market intelligence and search technology leader My Telescope to address this issue.
“A massive issue that has always existed in advertising and marketing is that there has not been a universal metric that measures the impact of media and advertising on purchasing and decision intent – until now,” said Farella.
Research done by the IPA found that Share of Search acted as a strong proxy for the consumer demand side of market share, and that Share of Search is dynamic; when one changes, the other changes. Additionally, when brand sentiment is measured alongside share of search, it creates a complete picture of what the future might look like in terms of how a brand might stack up against their competitors. This means that no matter the industry, brands can accurately measure the trends of the market using real-time data to predict consumer buying behavior.
For example, if college recruiters at Stanford see an uptick in Share of Search and sentiment toward another competing school like Harvard, they would also be able to drill down into the other keywords being searched, such as “financial aid”, “housing”, or “student life” in order to determine what would make a student choose one institution over another. Then, using this data, recruiters would know which topics to discuss with potential candidates and where to spend valuable marketing dollars to persuade candidates to commit.
According to the IPA’s research, branded search metrics have been proven to have a direct correlation with sales, with an average correlation of 83%. This means that if a search increases by 100%, the sales for that brand or topic increases by 83%. The remaining difference can be explained by influencing factors such as price or supply issues.
Farella states that by analyzing this data, marketers can get a better idea of how their investments in marketing and recruitment campaigns might play out over time. This benefits all aspects of advertising from understanding trends that might affect creative decisions to helping media buyers understand how much money they may want to invest in their campaigns to achieve ROI and increase their share of the market in the long run.
“By investing in a tool that uses search and sentiment analysis for proven forecasting of business demand, brands will finally be able to take actionable insights that increase ROI and create sustainable, repeatable campaigns that drive business success,” said Farella.
Conclusion
By leveraging Share of Search tools, like MyTelescope, which uses 20 different data modeling tools like Share of Search, Google search volumes, and weighted sentiment analysis, colleges and universities can track potential student interest to make more informed decisions about their marketing spend and where to heighten their efforts to reach new candidates and strengthen loyalty with existing ones. Agencies of all sizes, Fortune 500 companies, and other institutions have already begun adopting this metric as an advertising standard in order to more effectively predict their market potential. As familiarity with Share of Search continues to grow, it may be poised to become the universal standard metric of campaign success that marketers and recruiters have been looking for all along.